
Ballistic charts promise a comforting illusion: plug in a few numbers, print a tidy table, and suddenly gravity, wind and physics all agree to behave. In reality, those neat rows of drop and drift are closer to a weather forecast than a guarantee, and the fine print is written in variables most shooters barely think about. The charts are useful, but they are only a sketch of what happens between muzzle and target, not a photograph.
To understand why those predictions so often fall apart on the firing line, you have to look past the pretty graphs and into the messy details of bullet shape, air density, scope mechanics and human input. Once you see how many assumptions are baked into a typical trajectory table, it becomes obvious why the real story of where your bullet lands is written on steel and paper, not in a spreadsheet.
Ballistic charts are only as honest as the numbers you feed them
I like to think of ballistic calculators as very polite liars: they will confidently tell you whatever you ask, as long as you do not mind that the answer depends entirely on the fantasy world you typed in. The core of most charts is the ballistic coefficient, that magical number that claims to describe how well a bullet slips through the air. On paper, knowing that coefficient lets you predict how far a round will fly and how fast it will slow down, but in practice the value itself is often more marketing than math.
Even when the manufacturer is honest, the coefficient is only a starting point. Real drag depends on velocity, air density and bullet shape, which is why more advanced tools like Hornady’s 4DOF system lean on detailed drag models instead of a single number. In a tutorial for that system, Hornady stresses that if you put good data in, you get good data out, and that the library covers far more than just Hornady bullets, but the warning is baked in: garbage in, garbage out. Guides that walk through How to Determine Ballistic Coefficient make the same point in more polite language, explaining that once you have a value that describes air resistance, the calculator applies complex math to predict flight. That math is only as accurate as the coefficient, the muzzle velocity and the environmental conditions you actually enter, which is why a chart that looks scientific can still be wildly wrong the moment you leave the theoretical bubble it assumes.
Real bullets live in real air, not in “standard conditions”
On a chart, the atmosphere is usually a single tidy line: standard temperature, standard pressure, standard humidity, as if the bullet were flying through a climate-controlled tunnel. Outside, the air is more chaotic and far less cooperative. When bullet makers test their projectiles, they use a standard environment so they can compare apples to apples, but that same guidance notes that this is a lab convenience, not a reflection of the hillside you are actually shooting from. As one long range resource on When temperature and altitude change explains, shifts in air density can significantly alter drag and therefore drop, especially as distances stretch.
The effect is not unique to bullets. Golf coaches talk about Altitude changing how a ball rolls and how hard you need to hit it, and the same physics applies to a projectile screaming downrange. Higher elevation means thinner air, which means less drag and flatter trajectories than any sea-level chart would suggest. Temperature swings do similar mischief, changing both air density and the speed of the powder burn. That is why shooters who carefully log their “dope” over a summer of practice often discover that their winter impacts no longer match the table they trusted, even though the numbers on the page have not aged a day.
Gravity is simple, but your firing solution is not

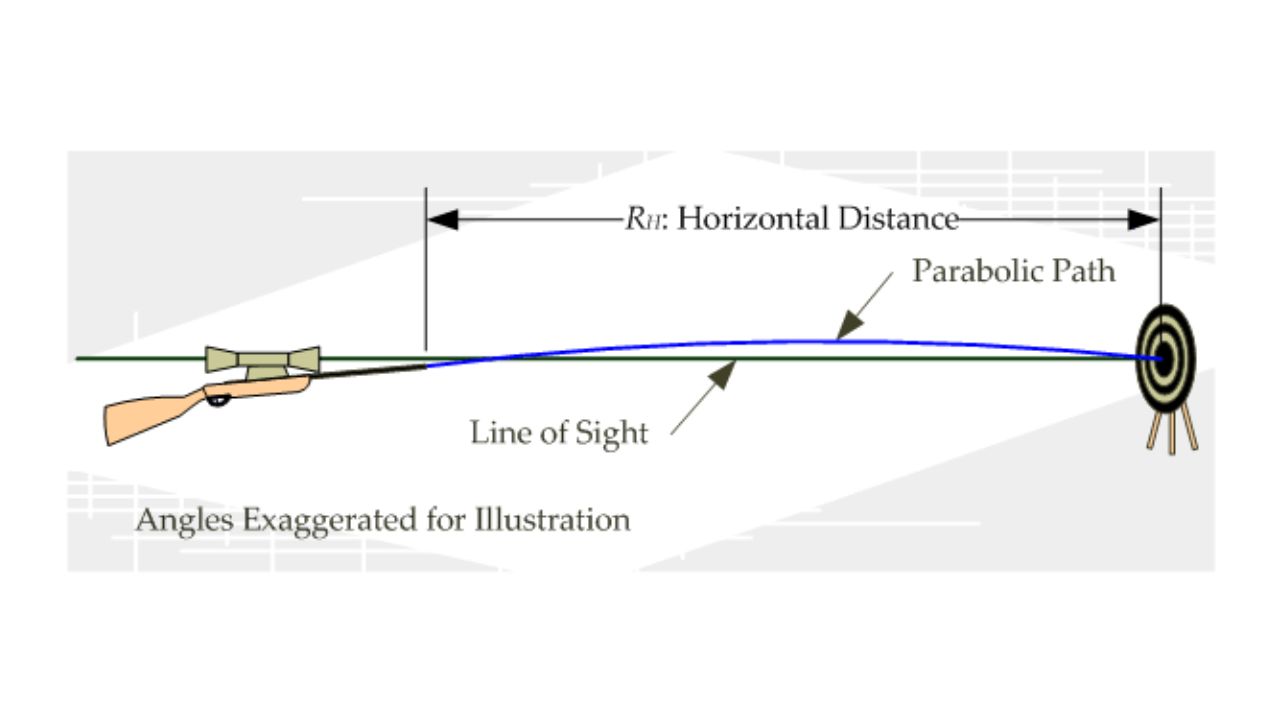
Gravity itself is boringly consistent, but the way we aim around it is anything but. Many charts quietly assume a perfectly level shot, even though rifles are rarely fired on a billiard table. Bullets do not simply leave the barrel and fall, they start slightly below the line of sight, rise as the bore is angled up relative to the optic, then arc back down, which is why a Depends on the angle of the gun explanation of a 200 yard zero has to clarify that the barrel is actually tilted slightly upward relative to the line of sight.
Even the basic idea of “bullet drop” hides a lot of nuance. A primer on Sep trajectory corrections walks through common misconceptions, including the notion that bullets always start dropping immediately in a straight line from the muzzle. In reality, the initial upward angle, the sight height over bore and the chosen zero distance all shape the arc. That is before you add wind, which most simple charts treat as a single constant value, even though gusts, terrain and mirage can turn a “10 mile per hour full value” assumption into a polite fiction. Artillery crews deal with the same complexity at a larger scale, which is why explanations of how big guns stay accurate emphasize rifling, spin stabilization and consistent procedures rather than blind faith in a table. One breakdown of Scenarios for artillery precision notes that spin and careful calibration are huge for repeatable accuracy, a reminder that the chart is only one piece of a much larger puzzle.
Your gear is probably lying to you a little
Even if your math is perfect, your hardware may be quietly sabotaging the plan. Scope turrets, for example, are supposed to move the reticle a precise amount with each click, but cheaper optics often treat that specification as more of a suggestion. One long range shooter venting that On a cheaper scope you might dial 10 mils and actually get 9 or 11 mils instead, which means your carefully calculated elevation is being mistranslated before it ever reaches the glass. A separate guide on Why Scope Tracking Important underlines the same point in more diplomatic terms, warning that if your scope does not track properly, you cannot trust that your adjustments match the numbers you dial.
The software side can be just as slippery. In one comparison, a shooter noticed that at 220 yards, one calculator predicted 4.34 MOA of adjustment while another predicted 4.00 MOA of drop, a meaningful difference if you are trying to hit a small target. Another long range newcomer who had finally gathered data out to 1,000 yards found that his actual elevation did not match what his app predicted, and started digging into whether his inputs, including environmental conditions, might be off.
The chart is a starting point, your dope is the truth
For all their flaws, ballistic charts are not useless, they are just overconfident. They give you a first draft of where to start, not a final script to read from. Experienced shooters treat them like a weather app: helpful for planning, but always subject to what the sky actually looks like when they step outside. One seasoned voice in a discussion about what to do when a dope chart does not add up put it bluntly, saying that First and foremost a dope sheet is what you get from actually firing the gun at the distance, while a ballistics spreadsheet is just a prediction. That hierarchy matters, because the steel and paper do not care what your phone thinks the bullet should have done.
Modern tools are getting better at narrowing the gap. Systems like Hornady’s 4DOF use detailed drag models and large bullet libraries to move beyond a single coefficient, and quick guides to Spin drift and other subtle effects help shooters understand why their impacts might be nudging sideways as distance grows. At the same time, some analysts have gone so far as to argue that As the Ballistic Calculators cannot be relied upon to give accurate bullet drops, pointing to military testing that still leans heavily on real-world firing to refine solutions. That is not an argument to throw your apps away, it is a reminder to treat them as a guide that gets you on paper faster, not as a substitute for the slow, slightly humbling process of building your own data one impact at a time.
Behind all of this is a simple truth that both forensic examiners and long range shooters quietly agree on: the bullet is the final witness. The chart, no matter how pretty, is just your best guess before you pull the trigger.